Main screen#
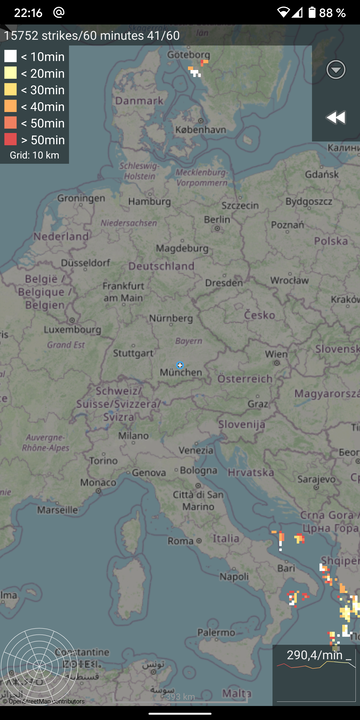
The time slider in the bottom allows to select a point in time out of the last 24 hours to be shown on the map. Moving the slider to the right activates the realtime mode.
Elements#
Top left – Legend#
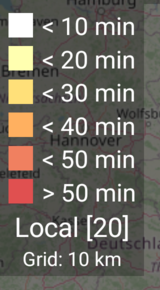
Time range for color-coded strike activity age used on map:
- “white”: latest lightning activity within the last 10 minutes
- …
- “dark orange”: latest lightning activity between 40 or 50 minutes ago
- “dark red”: latest lightning activity older than 50 minutes
Additional information
- Region
- Europe, North America, Asia, …
- Local[<size>], for limited local area data.
<size>degrees region size. - Not given for Global data.
- Grid baseline e. g. “Grid: 10km”
- Not given for Blitzortung.org data.
- Count threshold setting
- Not displayed for inactive count threshold setting
- For example, “# > 5” for a threshold of 5
- Only raster areas with strike counts greater or equalt to the threshold are displayed
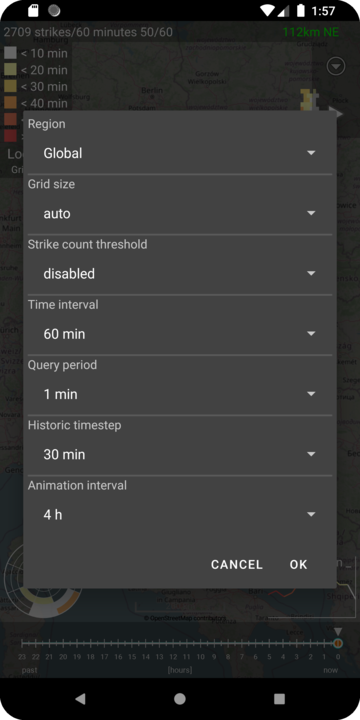
- Region
Tap the legend to open “Quick settings” dialog:
Top right – Menu / Control#
| Realtime | History | Animation |
|---|---|---|
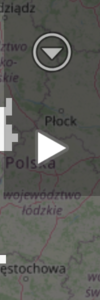 | 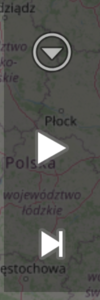 | 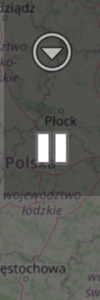 |
- Open menu (on devices without menu button)
- Realtime mode:
- Start Animation
- History mode:
- Start Animation
- Jump to Realtime
- Animation mode:
- Stop Animation
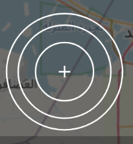
Bottom left – Alarm radar#
| active | inactive | outside data area |
|---|---|---|
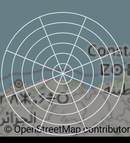 | 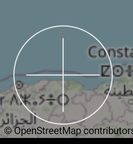 |  |
- Shows activity by distance for the current location
- Requires
- lightning data
- known location
- realtime mode
- Tap to center map around the location
- Long press to open a bigger version of Alarm radar
- When the current location is outside the lightning data area, the alarm radar shows an “outside” indicator
Bottom right – Histogram#
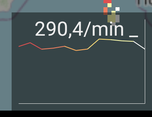
- Shows the development of strike rate over the given time period (for the data region)
- Tap to zoom out on region
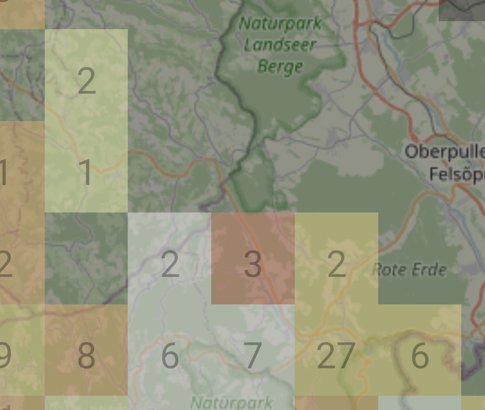
Map content#
The lightning activity is shown on the map in tiles with variable size (5 km, 10 km, 25 km, 50 km, 100 km). Each tile with recorded lightning activity in the selected time range gets colored with respect to the most recent activity within the current interval. The numbers which appear inside the tiles show the number of lightning events recorded in the area of the tile during the relevant time interval.
Home screen widget#
The app provides a home screen widget that displays the alarm radar view:
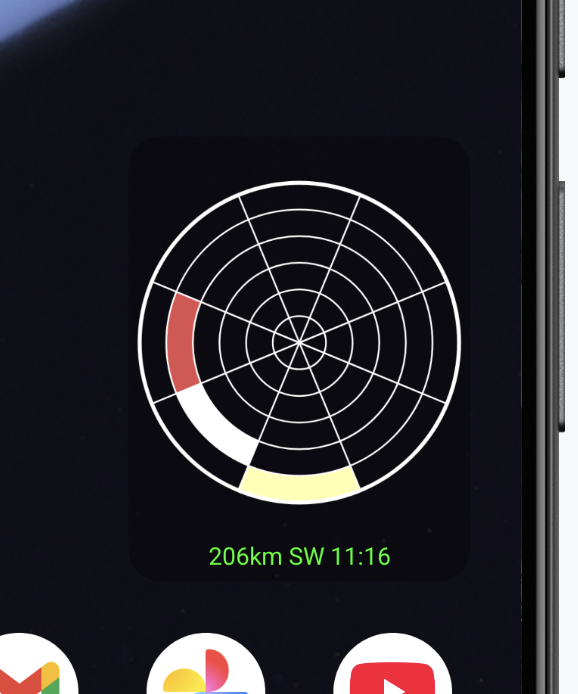
- Single tap: triggers an immediate data update (shows a progress indicator)
- Double tap: opens the main app
- The widget automatically updates every 15 minutes
Menu#
Preferences#
Open Detailed App settings
Alarms#
Open the alarm radar:
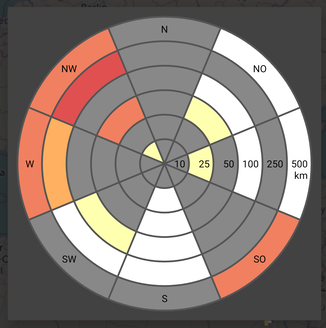
Color coding of last strike activity is shown according to the legend information.
Application log#
Show a dialog with internal app application log content. Can be used for immediate debugging. Creates an Email to send in the application log to get help.
Change log#
Show a dialog containing recent app features by version number
Information#
Show a dialog with app-related information.
Map usage#
Operations:
- Double-tap to zoom in
- Pinch to zoom
- Slide to move
- Long press to select location for manual location mode